Smokers
Yasemin Çakır

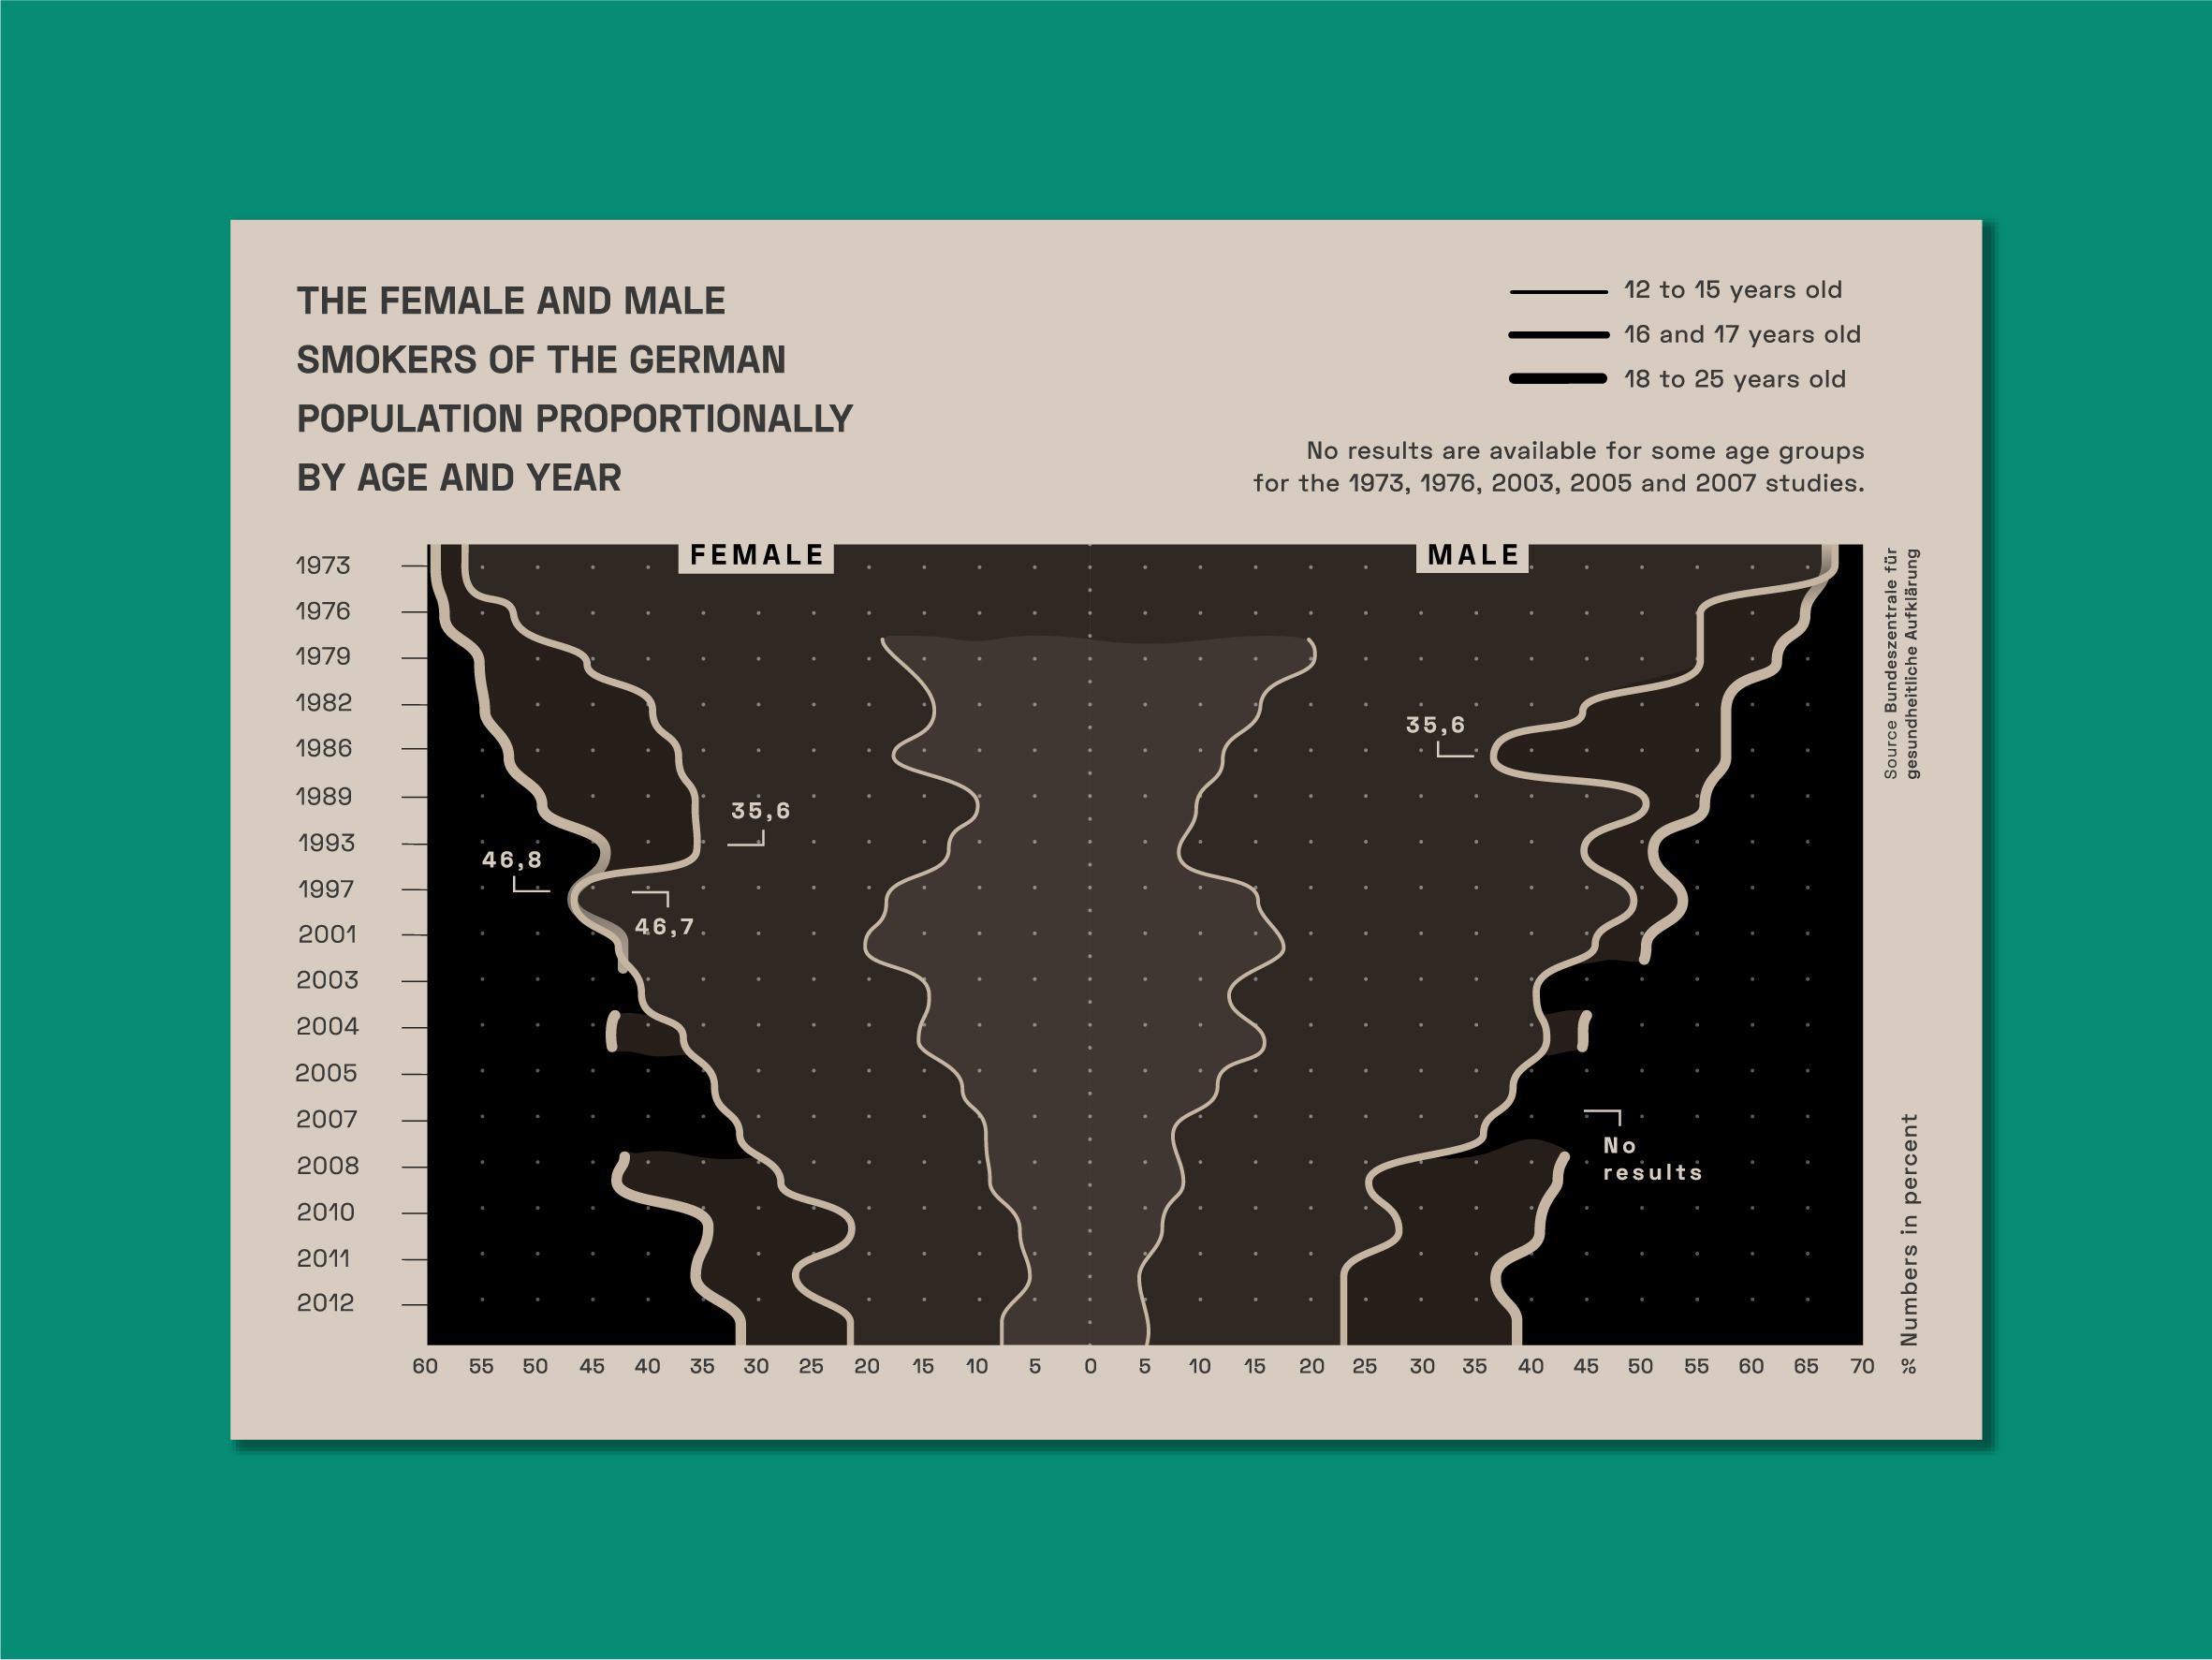
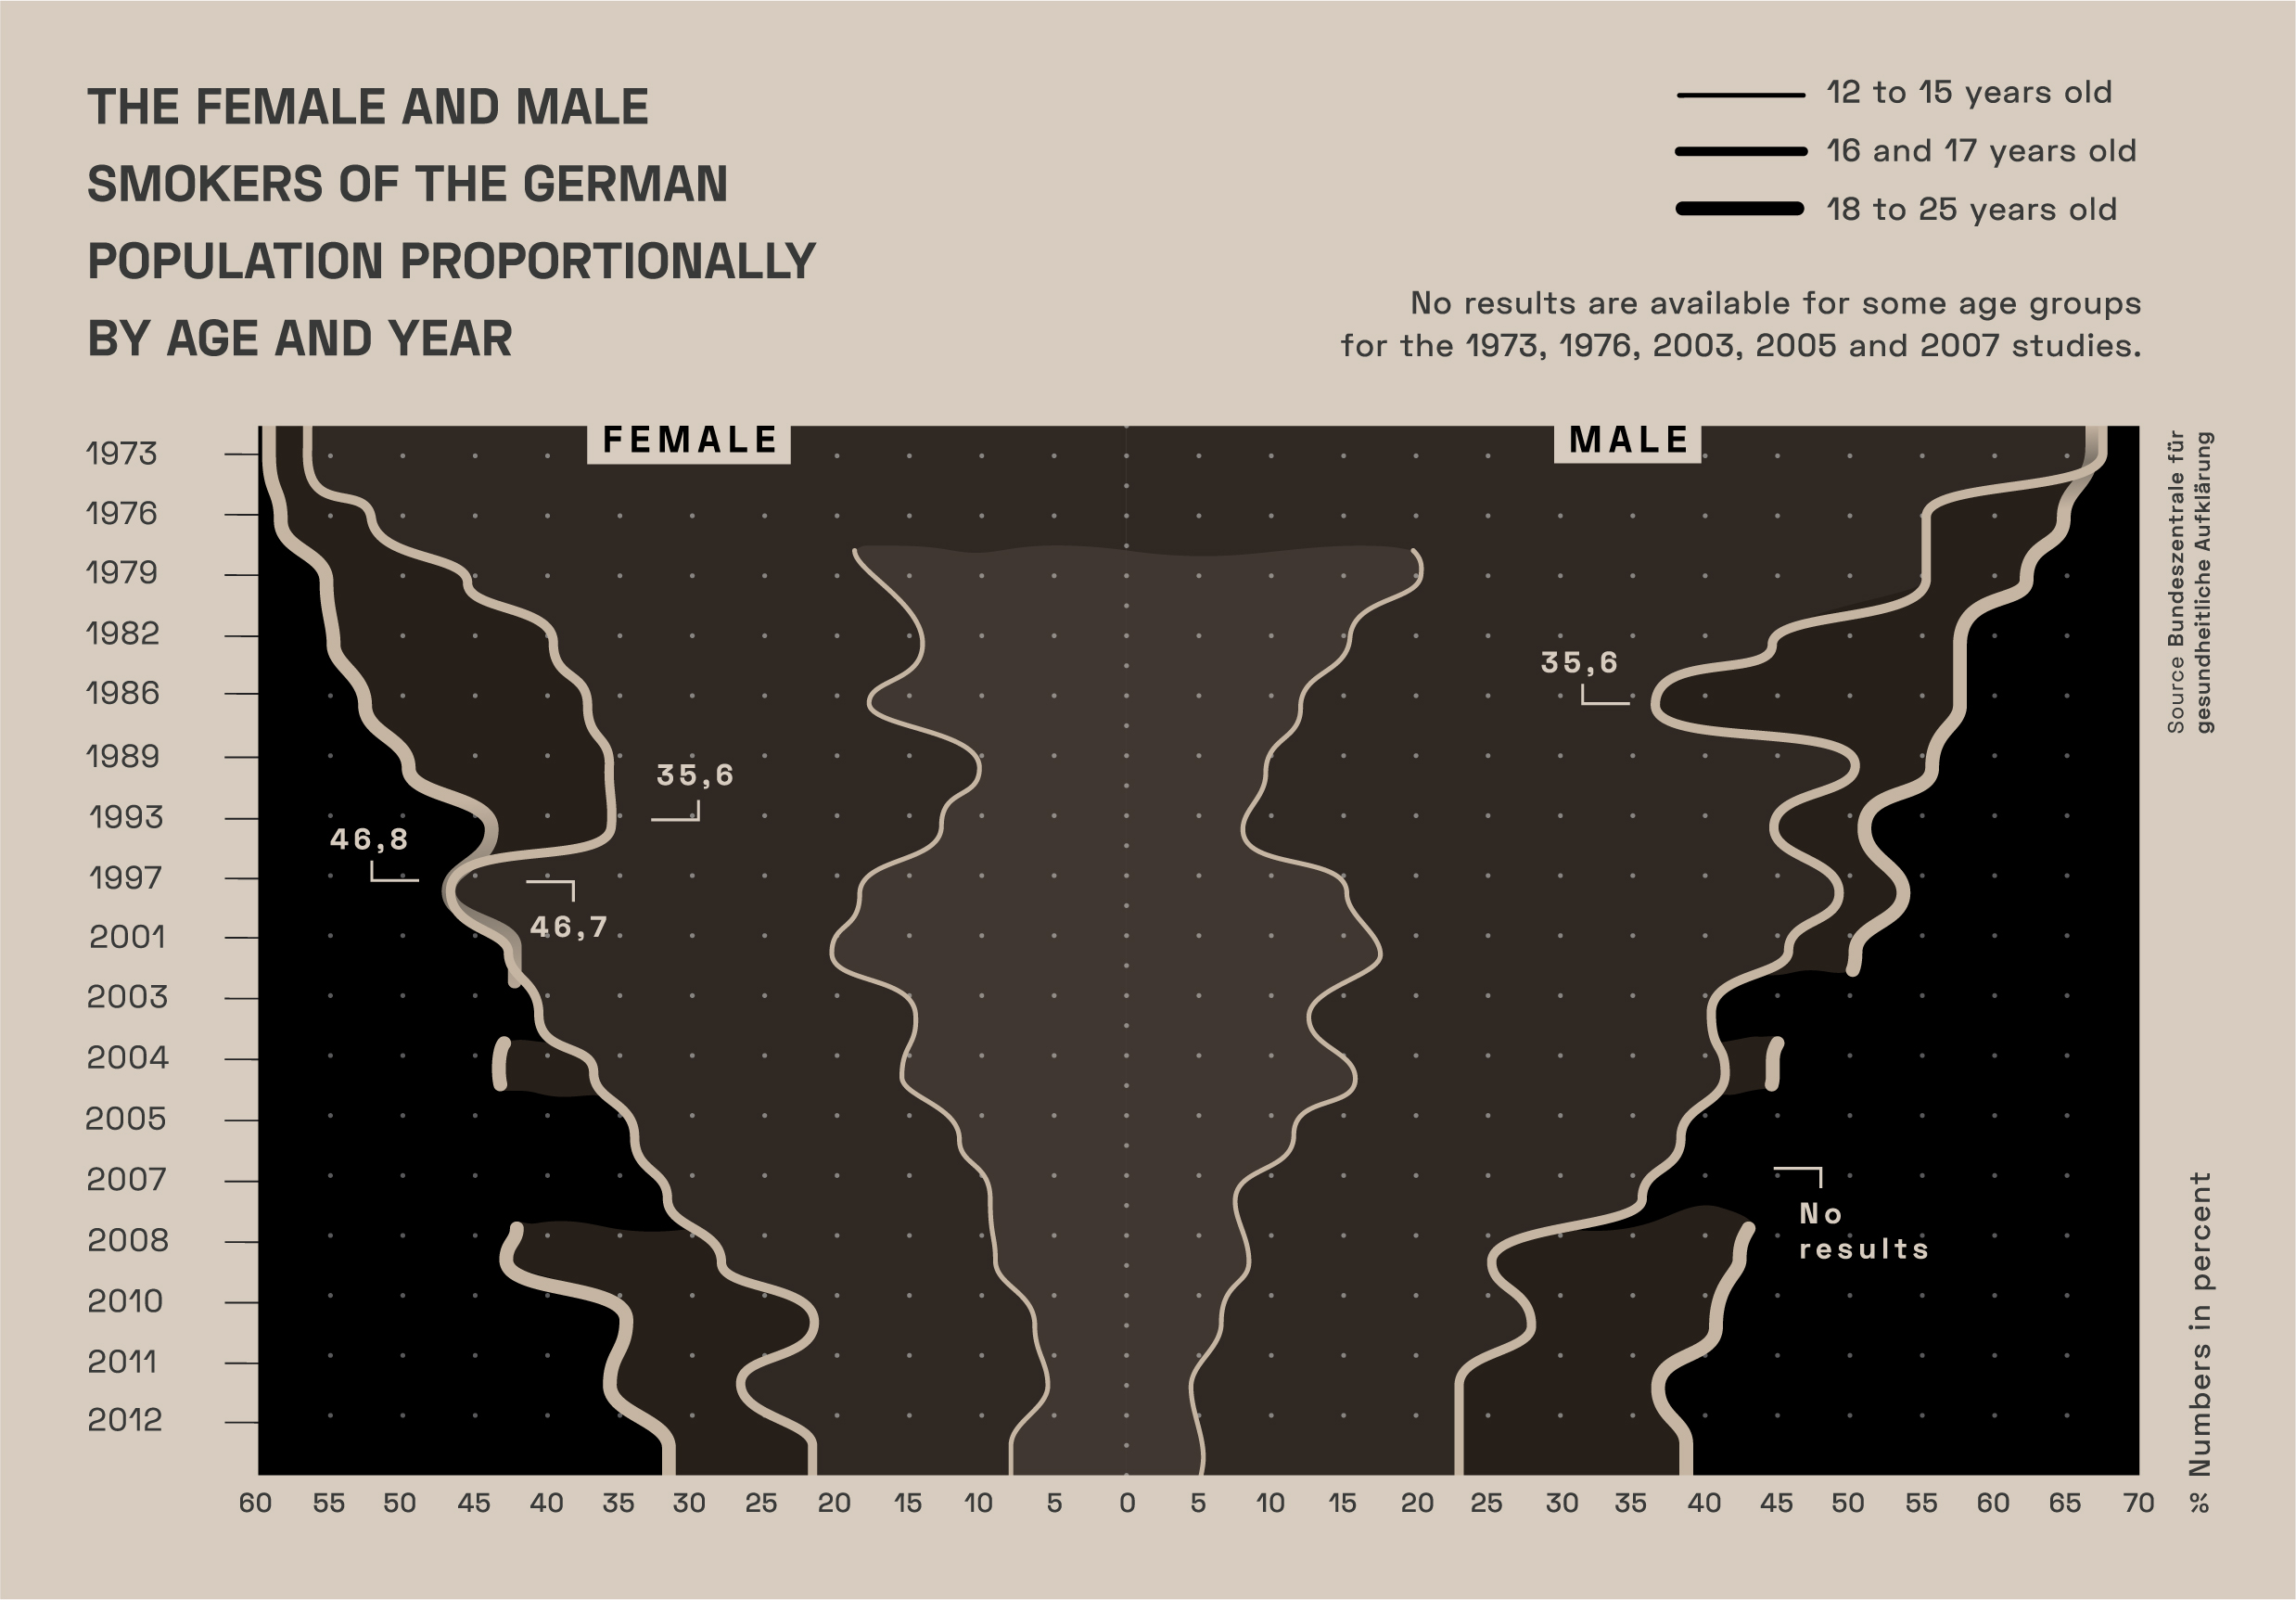
This data visualization shows the proportion of young German smokers by age group, in each year and how the number of smokers has decreased in the observed period. The missing parts of the dataset have also been left blank in the diagram. The line diagram is divided into female and male on the x-axis, where they meet at the zero point in the middle.


