=max(A2:A12358)
Infoklasse
Nina Bender

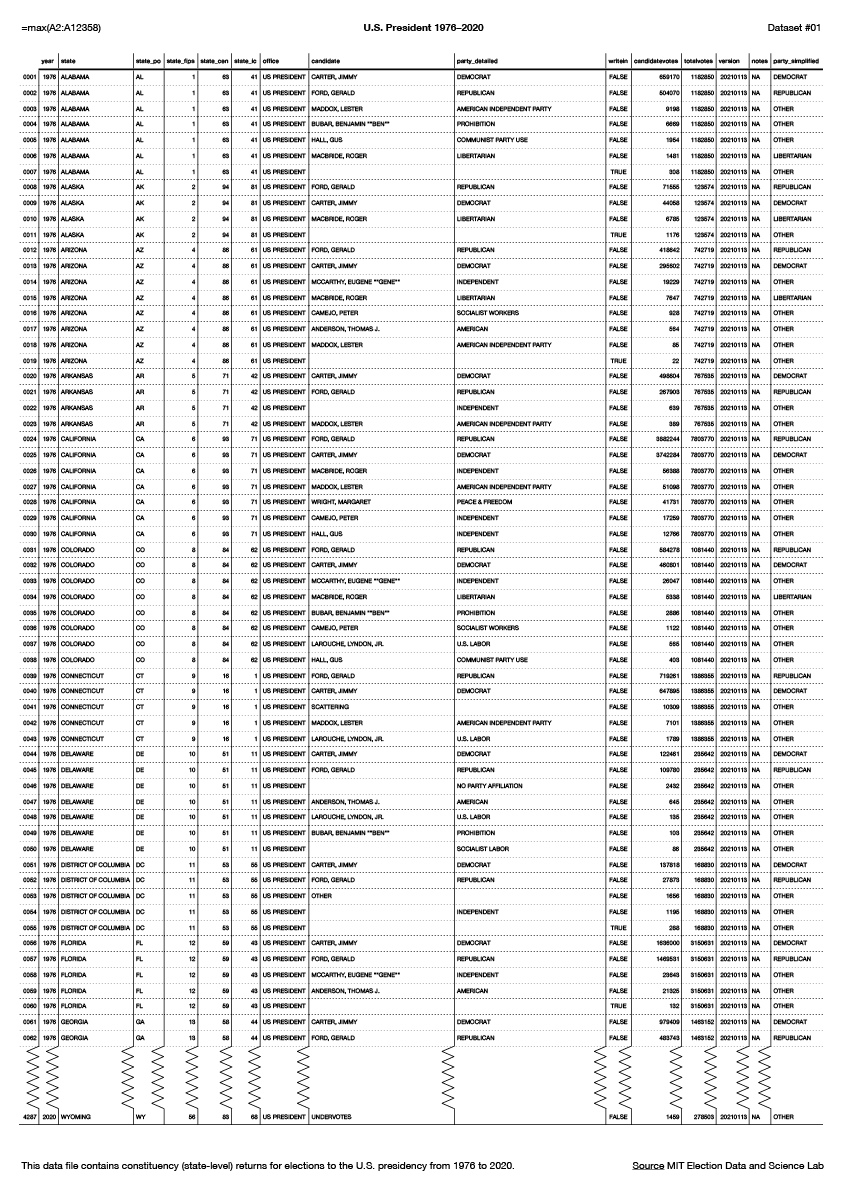
Each data visualisation starts with a dataset. Four datasets of different complexity (up to more than 2,5 million values) have each been analysed and visualised in short project periods of two to three weeks. The datasets served as a base – either subsets have been created to focus on specific parts and/or additional datasets have been researched in order to create graphics in one of 4 randomly assigned formats. The results will be exhibited at Medienhaus in room 204.